Character maps can list the corresponding value of a certain document in order to decipher a foreign object. These can be found for astrology, hieroglyphics and foreign languages.
Navigation maps are maps used to detail a route or a plan needed to take in order to get from point A to point B. You can notice these maps being used in GPS systems in cars or perhaps the Lewis and Clarke Journey to explore the West in early America.
Lorenz Curves can show how much a certain group of people can use of a whole while in turn showing the rest of the group without listing it. You can also add an average line to the graph.
Nominal Area Choropleths take an area and create a map detailing a certain piece of data and portray it upon the geographical map like this one on Florida.
Like other coordinate maps and bar graphs, the scatterplot uses two variables of data and pinpoints the correlation of them. These can be used to see trends.
Histograms are like bar graphs in the sense that both axis can portray a certain data and when combined they create the numerical data needed and that is represented.
Stem and leaf plots can detail the data into a easy to read table such as this one. The Stem could be a table and the leaves could be the ages of the people at the table.
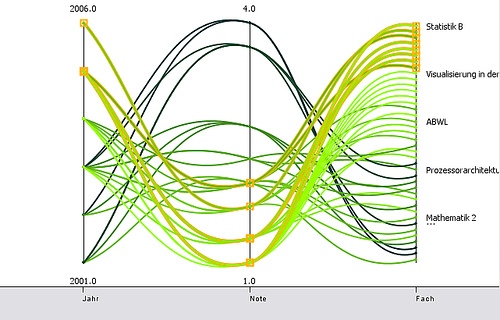
Star Plots can show the desired outcome with the center of the map and detail just how each possibility to get there can affect other sections of the study.
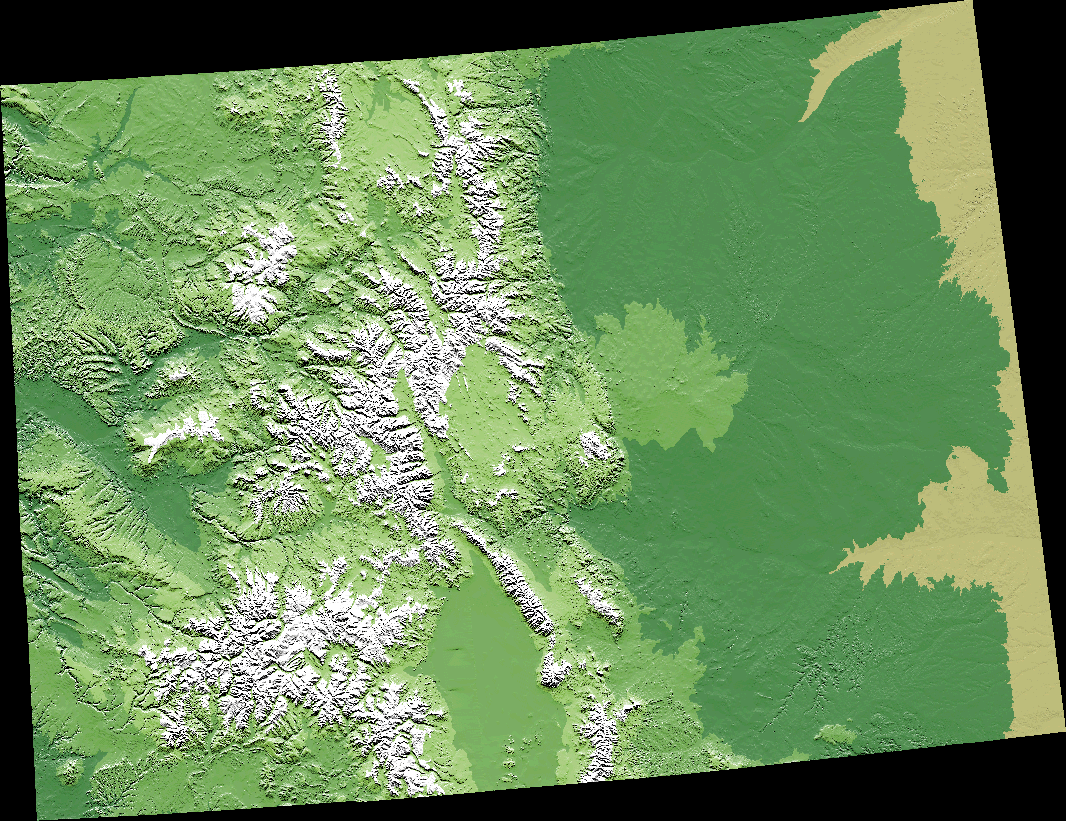
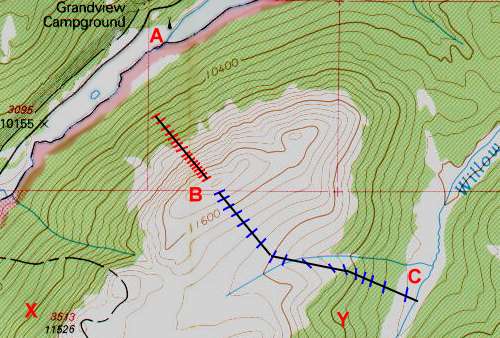
DRG maps like this one showcase the surface of the Earth in a confined area and show the composition in color and detail. These maps are also consistent with topographical maps in reference of the creation.
This Isohyet map shows the average rainfall of the area shown. This not-as-accurate representation still gets the point across and uses the averages and color shading with minimal area markings.
Isotachs separate the data even more into numerical data shown as well as the isobars from the previous map. This in-detail map can be read by one who knows what they are looking for with ease and detail.
Isobars are used to separate areas to divert the data on the map and portray the accurate message. These bars separate the atmospheric pressure on the various areas.
The LIDAR is a computer generated image of an area to show the height, elevation and factors of the specific zone. This can be used to see what is needed to help clear or clean up an area that is dangerous to enter.
Doppler radar uses the doppler effect to portray weather, storms, and other emergency dangers to the public. The colors can represent precipitation and the movements actually show the movements of the storms.
This black and white aerial photo displays a more distinct visual of the ground items and what is actually covering the ground. Rather than the energy focused infrared photo, this focuses on what is actually on the floor.
Cartographic animation maps portray data over time. Whether it be in a meteorology weather forecast or a timeline of data, the cartographic animation shows the movement and growth.
This statistical map shows how many people are online in a certain geographical area. Rather than the use of circles, dots, or lines, this gets straight to the point with values right on top of the respective area.
This political cartogram represents the sizes of the electoral colleges for each state while detailing which states have voted democrat vs republican. This map conveys more than one point with ease showing the weight each state pulls.
Flow maps quickly show the movement of a certain data without the clutter of boundaries and gets straight to the point. These tend to be easy to read and easy to understand as they convey the point rather quickly without clutter.
Isoline maps are usually used in meteorology. These isoline maps quickly display the necessary data using the different areas in different shades with the isolines to portray the different data values.
Choropleth Maps can be moving maps that break down data from a bigger scale into a smaller scale as seen in this map that goes from state to county/city detailing divorce rates.
propaganda maps, usually the use of governments and comics, are used to express opinion and lead the audience into a similar, wanted, method of thinking.
Hypsometric Maps are like topographical maps in showing elevation, but hypsometric maps use color, shading, contour, and a little more 3D-esque qualities.
PLSS Maps such as this one, represent cadastral data in a more efficient way without as much error. The simple numerical data and quadrants used represent zoning without duplication.
Cadastral maps are usually used to display boundaries, real estate, ownership properties and layouts. A common problem with these maps are moving, non-permanent boundaries that have to be constantly updated.
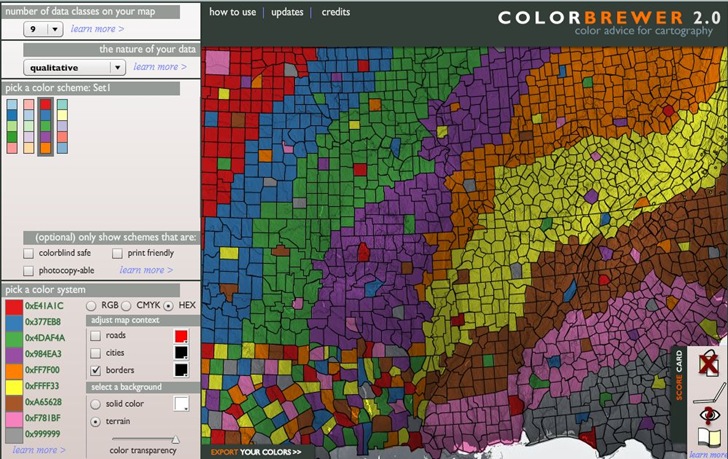
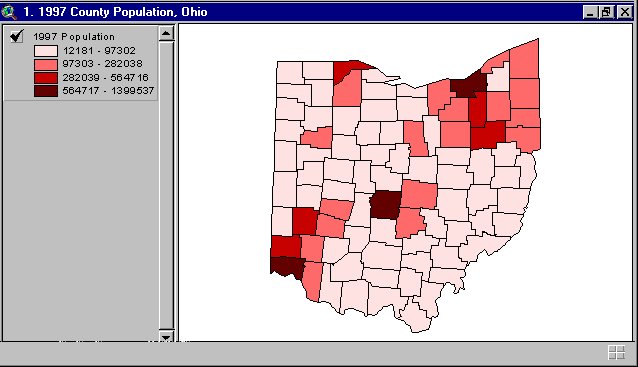
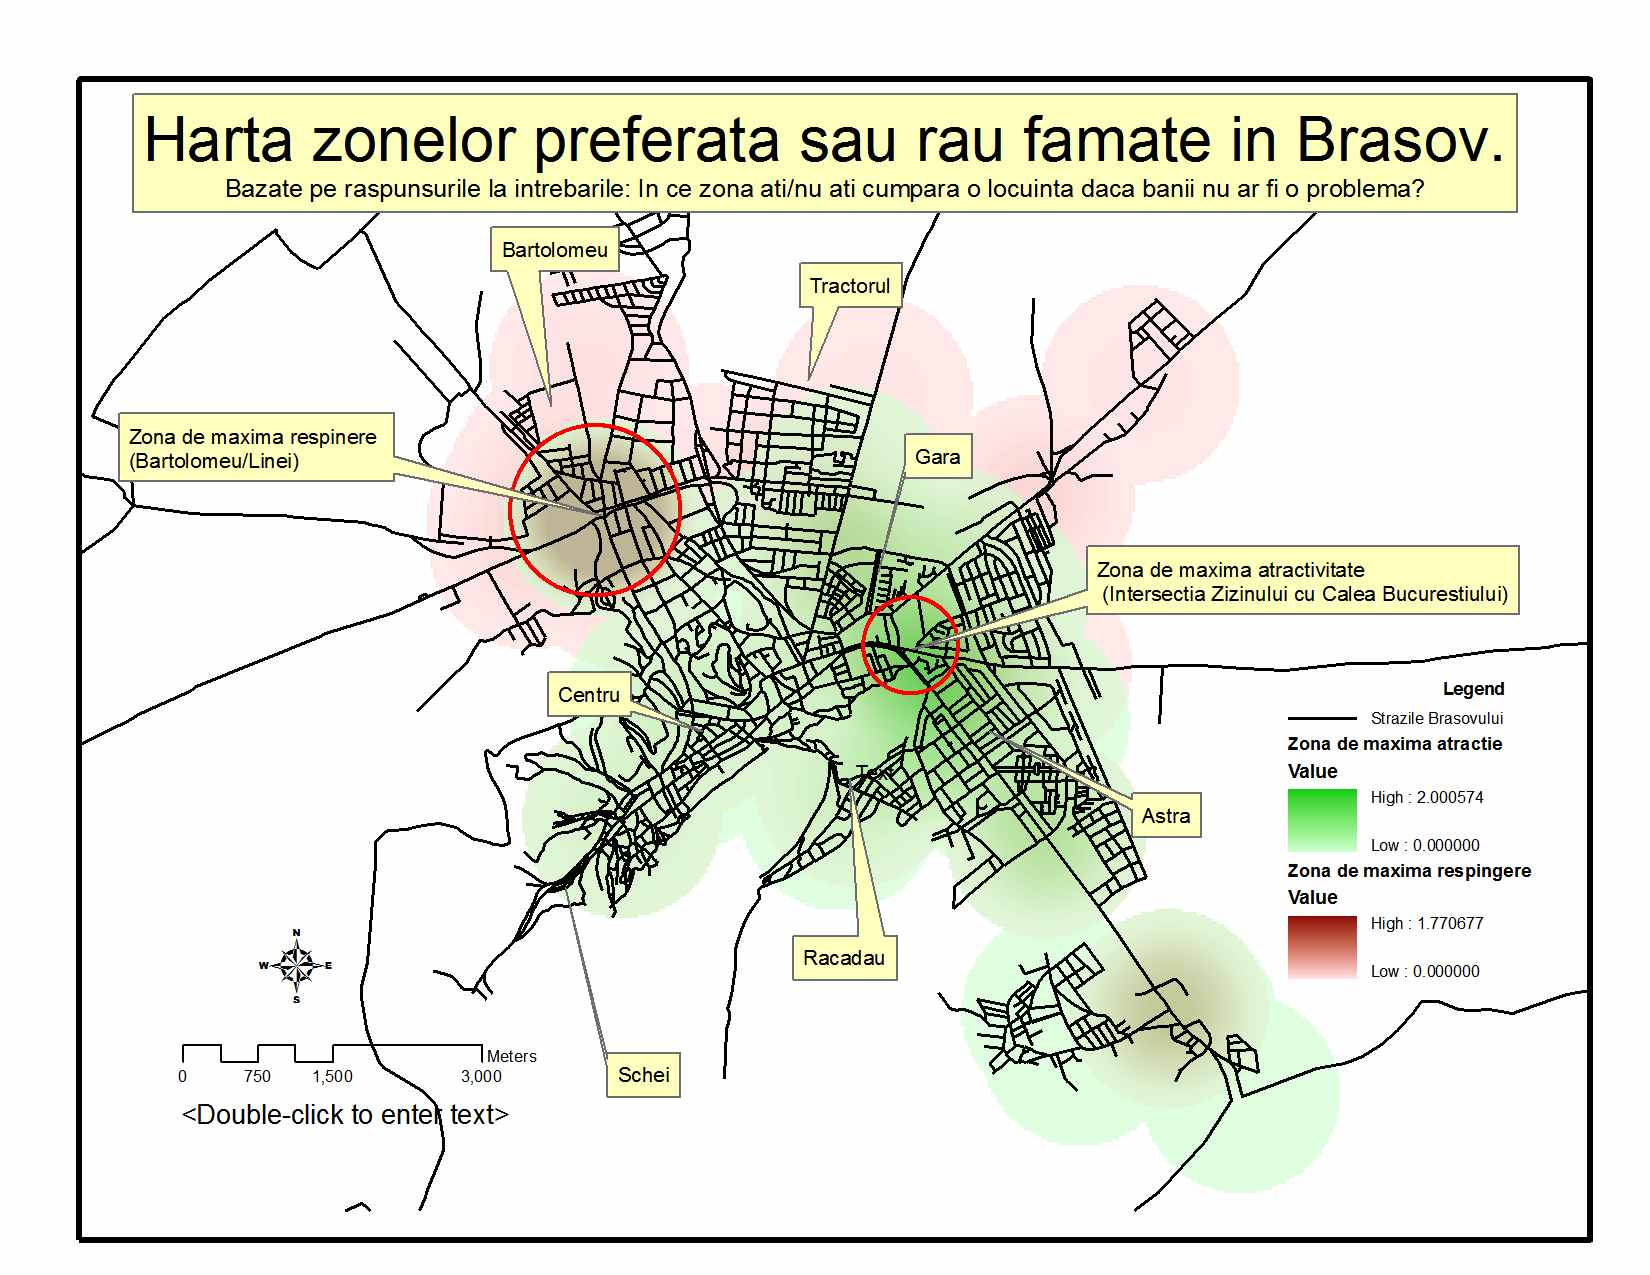
Thematic maps are used to portray data in a graphical way. Usually used in population representation or any other census data, different shades of a color can be used to display the data in a map.
Planimetric maps, usually used in transportation projects, display the horizontal position of planimetric features using symbols. Sometimes these maps attempt to portray a 3D accuracy on a 2D plane.


